Most business intelligence tools are built for data analysts. They assume you know what a dimension is, that you are comfortable writing a SQL query when the drag-and-drop does not quite do what you need, and that you have a data engineer somewhere who can set up the connections.
Most business teams do not have any of that. They have a marketing manager who needs to know which campaigns are driving pipeline, a finance director who needs a dashboard that does not require rebuilding every Monday morning, and a CEO who wants to see the numbers without asking IT to run a report.
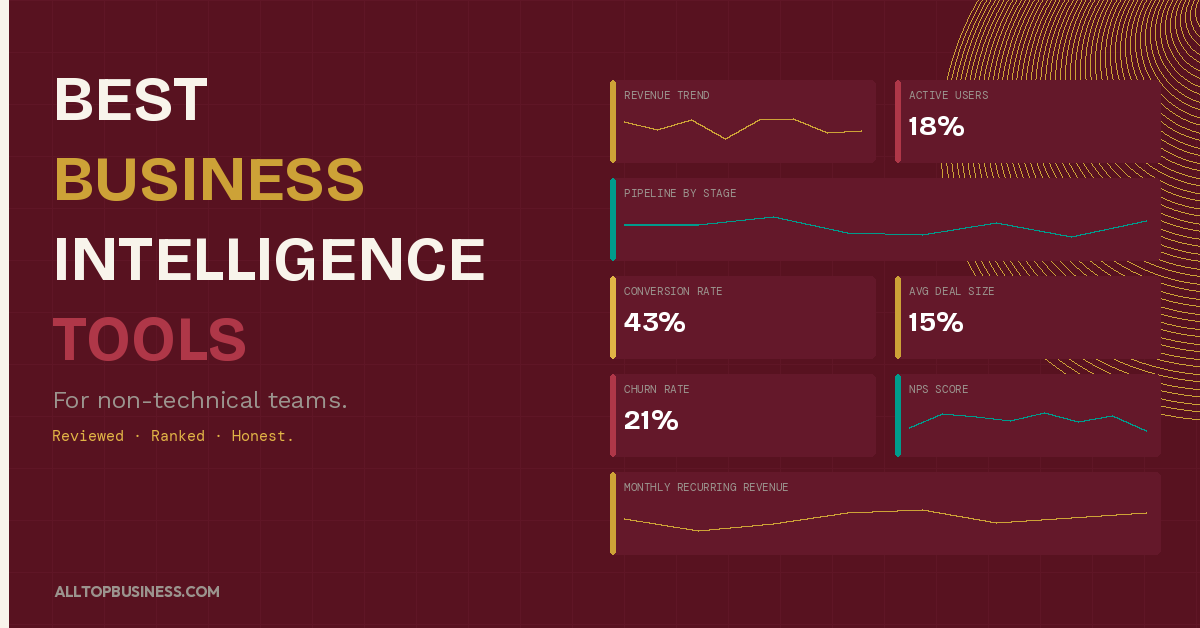
That gap between what most BI tools are built for and what most business teams actually need is the whole reason self-service BI exists. The business intelligence market is projected to reach approximately $30 billion by 2026, reflecting a compound annual growth rate of around 10%, driven by the need for real-time insights and the ability to make informed decisions based on comprehensive data analysis.
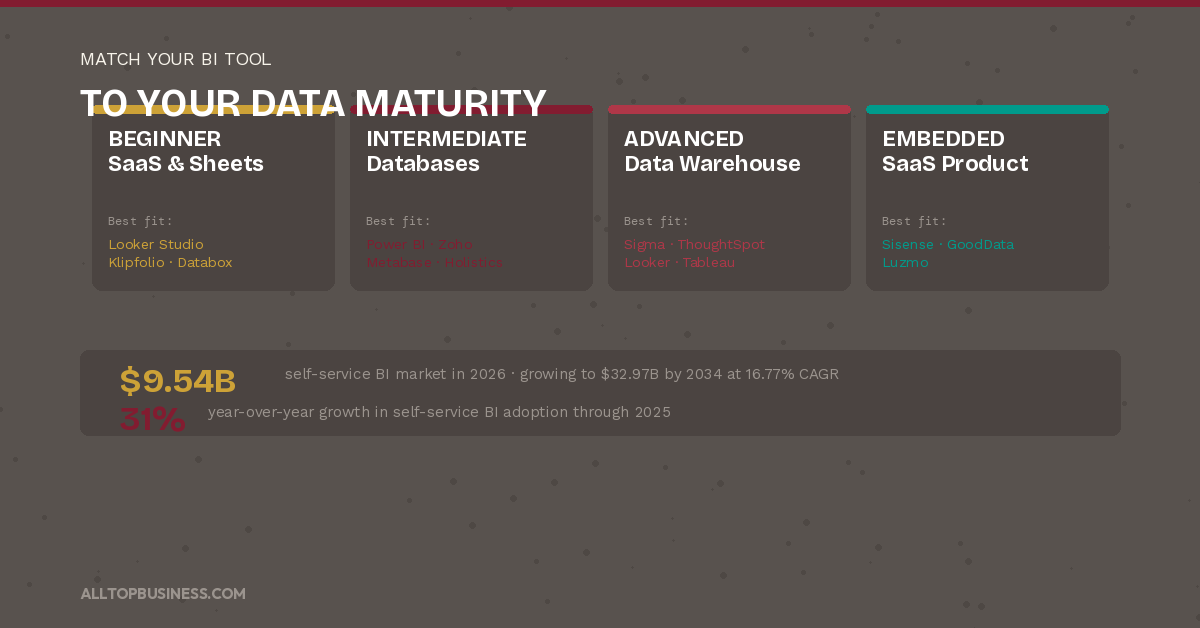
Within that broader market, the global self-service BI market was valued at $7.99 billion in 2025 and is projected to grow from $9.54 billion in 2026 to $32.97 billion by 2034, at a CAGR of 16.77%, reflecting how fast non-technical adoption is accelerating relative to the traditional analyst-focused BI market.
This guide covers the best BI platforms evaluated specifically through the lens of non-technical usability. We assessed over 35 platforms to arrive at this list. We considered not just features but adoption rates, the realistic learning curve for a business user with no data background, and the total cost of getting meaningful dashboards live within a reasonable timeframe.
For more B2B software guides covering finance and operations tools, browse the AllTopBusiness blog.
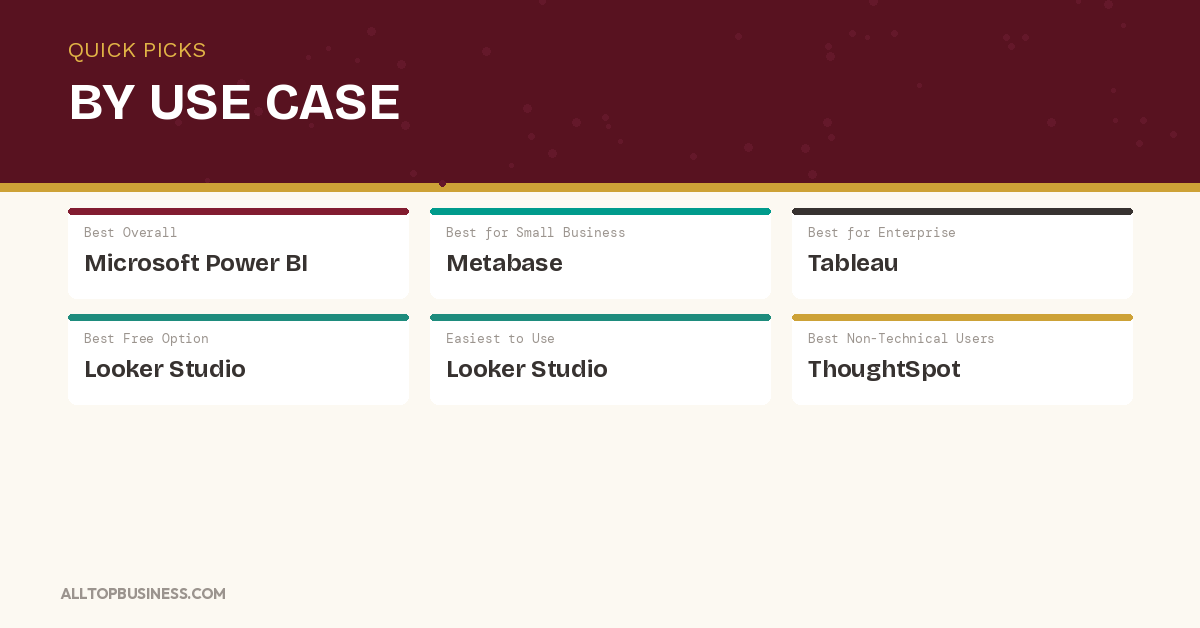
Quick Picks: Best Business Intelligence Tools for Non-Technical Teams
| Label | Pick |
|---|---|
| Best Overall | Microsoft Power BI: the most widely deployed BI platform globally, with the best balance of power and accessibility |
| Best for Small Business | Metabase: open-source BI with a genuinely free self-hosted tier and a clean interface that non-technical users adopt quickly |
| Best for Enterprise | Tableau: the gold standard for visual analytics at enterprise scale, now deeply integrated with Salesforce AI |
| Best Free or Low-Cost Option | Metabase: completely free when self-hosted, cloud-hosted Pro from $85/month |
| Best for Ease of Use | Looker Studio: free, browser-based, and connected to Google data sources out of the box |
| Best for Non-Technical Business Users | ThoughtSpot: natural language search-driven analytics lets business users ask data questions in plain English |
How We Selected These Business Intelligence Tools
Every platform on this list was evaluated against six criteria:
- Non-technical usability: Can a marketing manager or finance director build a useful dashboard without help from IT or a data engineer?
- Data connectivity: Breadth of native connectors to common business data sources
- Dashboard and visualization quality: Clarity, customizability, and interactivity of outputs
- AI and natural language features: The ability to query data in plain English or receive AI-generated insights
- Pricing accessibility: Value delivered at SMB and mid-market price points, not just enterprise tiers
- Implementation speed: Realistic time from signup to first productive dashboard for a non-technical user
Best Business Intelligence Tools: Comparison Table
| Tool | Best For | Starting Price | Free Plan | Key Integration |
|---|---|---|---|---|
| Microsoft Power BI | Microsoft-ecosystem teams of all sizes | Free / $10/user/mo | Yes | Microsoft 365, Azure, Salesforce |
| Tableau | Enterprise visual analytics | From $15/user/mo | No (trial) | Salesforce, AWS, Google Cloud |
| Looker (Google) | SQL-savvy teams on Google Cloud | Custom | No | BigQuery, Salesforce, AWS |
| Looker Studio | Small teams wanting free Google-connected dashboards | Free | Yes | Google Analytics, Ads, Sheets |
| Qlik Sense | Associative analytics for complex data exploration | Custom | No | SAP, Salesforce, AWS |
| ThoughtSpot | Natural language search-driven analytics | From $0 (limited) | Yes (limited) | Snowflake, BigQuery, Salesforce |
| Metabase | Non-technical teams wanting open-source BI | Free (self-hosted) / $85/mo | Yes | PostgreSQL, MySQL, BigQuery |
| Sisense | Embedded analytics for product teams | Custom | No | AWS, Azure, Salesforce |
| Sigma | Spreadsheet-native analytics on cloud warehouses | From $300/mo | No (trial) | Snowflake, BigQuery, Databricks |
| Domo | Broad integrations with 1,000+ connectors | Custom | No | Salesforce, SAP, AWS |
| Klipfolio | SMB KPI dashboards with fast setup | From $90/mo | No (trial) | Google Analytics, HubSpot, Xero |
| Zoho Analytics | Budget-conscious teams in the Zoho ecosystem | Free / from $24/mo | Yes (2 users) | Zoho CRM, QuickBooks, Salesforce |
| Databox | Marketing and sales KPI tracking for SMBs | Free / from $47/mo | Yes | HubSpot, Salesforce, Google Analytics |
| Holistics | SQL-first governed reporting for modern data teams | From $200/mo | No (trial) | BigQuery, Snowflake, PostgreSQL |
| GoodData | Embedded analytics and governed multi-tenant BI | Custom | No | Snowflake, BigQuery, Redshift |
| Luzmo | Embedded analytics for SaaS products | From $149/mo | No (trial) | PostgreSQL, MySQL, BigQuery |
| Yellowfin BI | Enterprise reporting with data storytelling | Custom | No | SAP, Oracle, Salesforce |
1. Microsoft Power BI
The most widely deployed BI platform globally (the strongest choice for Microsoft-ecosystem teams)
Microsoft Power BI is the benchmark self-service BI tool for business teams globally and the default starting point for any organization already running Microsoft 365. It connects natively to Excel, SharePoint, Teams, Azure, and hundreds of third-party data sources, and the Power BI Desktop application lets business analysts build dashboards without writing code through a drag-and-drop interface that has improved significantly with each annual release.
The platform’s Copilot AI features, embedded across the 2026 version, let business users ask questions about their data in natural language and receive automatically generated visualizations and narrative summaries. For finance teams that want to ask “why did revenue drop in Q3?” and get an answer without waiting for a data analyst to run a report, Power BI’s Copilot integration is the most seamlessly implemented AI in the mainstream BI market.
Power BI’s free desktop version is fully functional for individual use and report building. The Pro license at $10 per user per month unlocks sharing and collaboration across the organization. Premium Per User at $20 per month adds AI features, larger dataset capacity, and paginated reports.
According to IDC research, organizations using self-service BI tools like Power BI report making decisions an average of 5 times faster than teams relying on manual reporting processes.
What it does well:
- Native Microsoft 365 integration means data from Excel, SharePoint, and Teams connects without custom setup
- Copilot AI generates visualizations and narrative summaries from natural language questions
- Free desktop version with full report-building capability for individual analysts
- The largest BI community globally with extensive documentation, templates, and learning resources
- Competitive pricing at $10 per user per month for organizational sharing
Where it falls short:
- Non-Microsoft data source connectivity requires more configuration effort than Google-native tools
- The interface, while improved, still has a steeper learning curve than Looker Studio or Klipfolio for true beginners
- Premium features require Premium Per User or Premium capacity licensing at a significantly higher cost
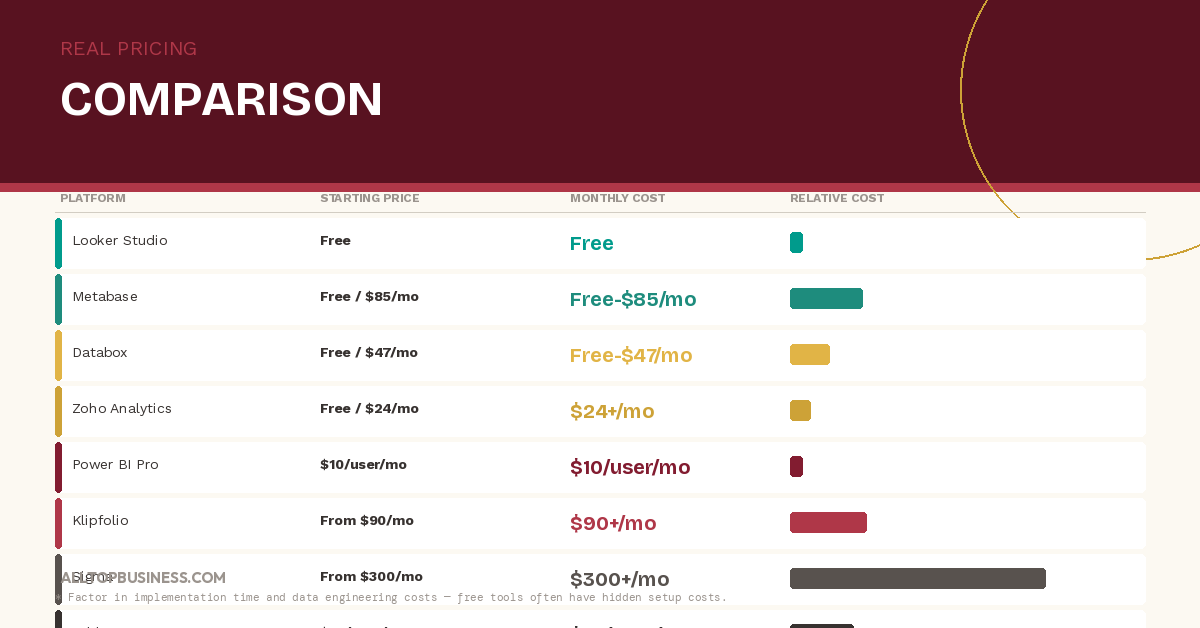
Pricing: Free desktop. Pro from $10/user/month. Premium Per User from $20/user/month.
Best for: Mid-market and enterprise teams already running Microsoft 365 who want a powerful, well-supported BI platform with native Microsoft data connectivity and AI-powered natural-language querying.
2. Tableau
The gold standard for visual analytics (the strongest choice for data-forward enterprise teams)
Tableau is the most visually sophisticated BI platform available and the tool that data visualization professionals reach for when presentation quality and analytical depth both matter. Its drag-and-drop interface produces charts, maps, and dashboards that consistently look more polished than any other platform in the category, and its analytical depth supports complex calculations and data blending that simpler tools cannot match.
Following its acquisition by Salesforce, Tableau has gained deep integration with Salesforce CRM data and Einstein AI capabilities. Tableau Pulse, launched in 2025 and now widely deployed in 2026, delivers AI-generated metric digests directly to business users in Slack and email, which surfaces data insights to non-technical stakeholders who would never log into a BI dashboard on their own.
Tableau’s primary challenge for non-technical teams is its learning curve. Building a dashboard from scratch requires more conceptual knowledge than Power BI or Looker Studio. For organizations willing to invest in training, the outputs justify the effort. For teams that need dashboards built by the business users themselves with no data support, Tableau is not the most beginner-friendly choice.
What it does well:
- The best data visualization quality in the category by a meaningful margin
- Tableau Pulse delivers AI-generated metric digests to Slack and email without users logging in
- Deep analytical capability for complex calculations, blending, and statistical analysis
- Native Salesforce integration for CRM-connected sales and marketing analytics
- Large global community with extensive pre-built templates and learning resources
Where it falls short:
- Steeper learning curve than Power BI or Looker Studio for non-technical users building dashboards themselves
- Pricing is significantly higher than Power BI at equivalent functionality
- Heavy data preparation still often requires a data engineer or Tableau Prep expertise
Pricing: Tableau Viewer from $15/user/month. Explorer from $42/user/month. Creator from $75/user/month. Enterprise custom pricing.
Best for: Data-forward enterprise and mid-market teams with dedicated analysts or BI professionals who need the highest-quality visual analytics and are willing to invest in training to get there.
3. Looker (Google Cloud)
The best BI platform for SQL-comfortable teams that want a governed semantic layer
Looker is Google Cloud’s enterprise BI platform, built around LookML, a semantic modeling layer that defines metrics and business logic centrally so every team pulls from the same definitions. When your sales team and your finance team both need to calculate “monthly recurring revenue,” Looker ensures they get the same number every time rather than each team maintaining their own spreadsheet formula.
Looker is not designed for true non-technical users who want to build their own dashboards. It requires SQL knowledge for initial setup and LookML for modeling. Where it excels is in serving governed, consistent analytics to large numbers of business consumers who pull from a trusted single source of truth.
For non-technical teams that need data served to them reliably, Looker is excellent. For non-technical teams that need to build their own dashboards, Looker Studio (below) is the more practical choice.
What it does well:
- The centralized semantic layer ensures consistent metric definitions across the entire organization
- Governed analytics prevents the “multiple versions of the truth” problem that plagues spreadsheet-based reporting
- Strong Google Cloud and BigQuery integration
- Embedded analytics capabilities for product teams
- Scales well to large enterprise deployments with complex data governance requirements
Where it falls short:
- Requires SQL knowledge and LookML expertise for initial setup and model development
- Not designed for self-service dashboard building by non-technical users
- Custom enterprise pricing is at the higher end of the market
Pricing: Custom enterprise pricing.
Best for: Enterprise data teams that want a governed semantic layer ensuring consistent metric definitions across large organizations, and product teams that want to embed analytics in customer-facing applications.
4. Looker Studio
The best free BI tool for small teams connected to Google data sources
Looker Studio (formerly Google Data Studio) is a free, browser-based dashboard tool that connects natively to Google Analytics, Google Ads, Google Sheets, BigQuery, and dozens of other Google and third-party data sources. For marketing teams, e-commerce businesses, and small companies whose data primarily lives in Google’s ecosystem, Looker Studio provides genuinely useful dashboards at zero cost.
The tool is the most accessible entry point in the BI category for non-technical users. There is nothing to install; the interface is drag-and-drop, and templates for common use cases like Google Analytics dashboards and Google Ads performance reports mean a functional dashboard can be built in under an hour.
The limitation shows as data complexity grows. Looker Studio is not built for complex data modeling, calculated metrics beyond basic expressions, or connecting to enterprise data warehouses at scale. It is a reporting tool, not an analytics platform.
What it does well:
- Completely free with no usage limitations
- Native connectivity to the entire Google ecosystem out of the box
- Browser-based with no installation or IT involvement required
- The template library covers the most common marketing and e-commerce use cases
- Easy sharing and embedding for stakeholders who do not need to edit dashboards
Where it falls short:
- Not suitable for complex data modeling or enterprise-scale analytics
- Performance can slow significantly with large datasets
- Less polished visualization options than Power BI or Tableau
- Limited calculated metric capabilities for advanced use cases
Pricing: Free.
Best for: Small businesses and marketing teams whose data primarily lives in Google Analytics, Google Ads, or Google Sheets, and who need free, functional dashboards without IT involvement.
5. Qlik Sense
The best BI platform for organizations that need associative data exploration across complex datasets
Qlik Sense uses an associative analytics engine that works fundamentally differently from most BI tools. Rather than querying pre-defined relationships between data tables, Qlik’s engine holds all data relationships in memory and allows users to explore data by clicking on any value and seeing how every other dimension in the dataset responds. For complex datasets where unexpected correlations drive decisions, this associative approach surfaces insights that structured query-based tools miss.
Qlik Sense is available on cloud, on-premises, and hybrid deployment models, giving organizations flexibility that pure cloud-native tools cannot match. Its AI-powered Insight Advisor automatically generates chart suggestions and explains what is driving changes in key metrics.
What it does well:
- Associative analytics engine surfaces unexpected data relationships that query-based tools miss
- Flexible deployment across cloud, on-premise, and hybrid environments
- Insight Advisor AI generates chart suggestions and metric explanations automatically
- Strong governance and security for regulated industries
- NPrinting add-on for pixel-perfect report distribution to non-interactive consumers
Where it falls short:
- Learning the associative model requires more onboarding investment than standard drag-and-drop BI tools
- Pricing is at the enterprise tier and requires a custom quote
- Less modern interface than newer cloud-native competitors
Pricing: Custom enterprise pricing.
Best for: Enterprise organizations in regulated industries or with complex multi-source data environments that need deep associative data exploration alongside strong governance.
6. ThoughtSpot
The best BI tool for non-technical teams that want to ask data questions in plain English
ThoughtSpot is built around a single core premise: business users should be able to ask questions about their data in natural language and get instant, accurate answers. Its search-driven interface lets a marketing director type “revenue by region last quarter compared to previous year” and receive a visualization immediately, without building a dashboard or waiting for a data analyst.
SpotIQ, ThoughtSpot’s AI engine, automatically surfaces trends, anomalies, and insights across connected datasets without users needing to know what questions to ask. For organizations where the bottleneck is not data availability but the gap between data and business users who cannot access it, ThoughtSpot removes that barrier more directly than any other platform.
Self-service BI adoption grew 31% year-over-year through 2025, with 68% of organizations now operating a centralized data platform that enables self-service analytics, yet only 20% of organizations have enabled natural language querying for business users. ThoughtSpot specifically addresses that 20% gap.
What it does well:
- Natural language search lets any business user query data without SQL or dashboard-building skills
- SpotIQ AI automatically surfaces anomalies and insights without users specifying what to look for
- Connects to cloud data warehouses, including Snowflake, BigQuery, and Databricks natively
- LiveBoard feature provides real-time collaborative dashboards with AI-generated commentary
- Strong governance controls ensure that non-technical users only see data they are authorized to access
Where it falls short:
- Requires a cloud data warehouse as the underlying data layer — not standalone like Power BI or Tableau
- Pricing is enterprise-level for full functionality
- Less suitable for organizations without a modern cloud data infrastructure
Pricing: Free limited tier. Team from $95/user/month. Enterprise custom pricing.
Best for: Enterprise and upper mid-market organizations with modern cloud data infrastructure that want to democratize data access to non-technical business users through natural language querying.
7. Metabase
The best open-source BI tool for non-technical teams wanting accessible, affordable analytics
Metabase is the leading open-source BI platform and the strongest choice for non-technical teams that want meaningful data access without enterprise BI pricing. Its clean interface lets non-technical users ask questions about data without SQL knowledge through a point-and-click question builder, while data analysts can write custom SQL queries for more complex analysis within the same tool.
The self-hosted Community edition is completely free and covers the full analytics feature set. The cloud-hosted Pro plan starts at $85 per month for five users, which makes Metabase one of the most accessible paid BI options in the mid-market. For finance teams, operations managers, and marketing leads who want to query their database without bothering the data team, Metabase provides a genuinely usable solution at a price most SMBs can justify.
What it does well:
- Completely free when self-hosted — no licensing cost for the Community edition
- Point-and-click question builder requires no SQL knowledge for basic queries
- Clean, modern interface that non-technical users adopt with minimal training
- Automated dashboards with scheduled email delivery for non-interactive stakeholders
- Embedded analytics capability for SaaS products on paid plans
Where it falls short:
- The self-hosted version requires technical resources for installation and maintenance
- Less visualization sophistication than Tableau or Power BI for complex analytical requirements
- Enterprise governance and security features require the Pro or Enterprise tier
Pricing: Community edition is free (self-hosted). Pro from $85/month (5 users). Enterprise custom pricing.
Best for: SMBs and mid-market companies with a technical resource available for setup that want accessible, non-technical BI at the lowest possible total cost of ownership.
8. Sisense
The best BI platform for product teams that want to embed analytics in customer-facing applications
Sisense is an embedded analytics platform that allows software companies to build white-label analytics dashboards directly into their products. For SaaS companies that want to give their customers data visualization and reporting capabilities without building an analytics layer from scratch, Sisense provides a production-grade embedded BI engine with customizable theming and multi-tenant architecture.
The platform’s Fusion framework lets product teams embed dashboards that match their product’s visual identity and control exactly what data each customer tenant can see. The AI-powered Sisense Pulse monitors KPIs and sends proactive alerts when metrics move outside defined thresholds.
What it does well:
- Market-leading embedded analytics with white-label customization
- Multi-tenant architecture controls data visibility per customer account
- Sisense Pulse proactive alerting when KPIs deviate from expected ranges
- Handles large, complex datasets with strong query performance
- Flexible API for deep integration into product workflows
Where it falls short:
- Not designed as a standalone internal BI tool for business teams
- Custom pricing at the enterprise level
- Implementation requires developer resources for embedded use cases
Pricing: Custom enterprise pricing.
Best for: SaaS companies and software product teams that want to embed analytics dashboards into customer-facing applications rather than using BI for internal business reporting.
9. Sigma
The best BI tool for non-technical users on cloud data warehouses who think in spreadsheets
Sigma is a warehouse-native BI platform that presents cloud data warehouse data through a familiar spreadsheet-like interface. Business users who are comfortable in Excel can work with Snowflake, BigQuery, or Databricks data at full scale without learning SQL or a new visualization paradigm. The spreadsheet interface lowers the conceptual barrier for finance and operations teams that already think in rows and columns.
For organizations where the bottleneck is getting business users to engage with analytics tools at all, Sigma’s familiarity advantage is real. Its warehouse-native architecture means no data movement and inherited security. The $300 per month minimum does price out small teams, and its relatively immature ecosystem compared to established platforms is worth noting.
What it does well:
- Spreadsheet interface reduces learning curve for Excel-native business users
- Full warehouse-native execution means data never leaves the warehouse
- Inherited warehouse security controls without additional configuration
- Handles datasets at any scale — warehouse compute manages the query performance
- Unlimited users on the Essentials tier at $300/month flat
Where it falls short:
- Requires a cloud data warehouse — no standalone deployment without Snowflake, BigQuery, or Databricks
- $300/month minimum prices out small teams that do not need warehouse-scale analytics
- Visualization sophistication is more limited than Tableau for advanced analytical requirements
Pricing: Essentials from $300/month (unlimited users). Professional and Enterprise custom pricing.
Best for: Finance and operations teams at mid-market and enterprise companies already running Snowflake, BigQuery, or Databricks that want to explore warehouse data through a spreadsheet-like interface without SQL knowledge.
10. Domo
The best BI platform for organizations with extremely diverse data sources needing 1,000+ connectors
Domo offers one of the broadest integration platforms in BI, with over 1,000 pre-built connectors combined with Magic ETL for no-code data transformation, analytics, and AI in a single cloud-native platform.
One important context for any 2026 evaluation: on February 19, 2026, Domo’s board announced exploration of strategic alternatives, including a potential sale or acquisition, engaging Jefferies as financial advisor. FY2025 revenue was $317 million with net losses of $82 million. Financial instability creates uncertainty about product direction, pricing stability, and customer support continuity. This is worth factoring into a multi-year platform commitment.
What it does well:
- 1,000+ pre-built connectors — broadest integration coverage in the BI category
- Magic ETL for no-code data transformation without a data engineer
- All-in-one model covering integration, ETL, analytics, and AI in one platform
- Strong mobile experience for executives reviewing dashboards on the go
- AppStore of pre-built business apps on top of the BI platform
Where it falls short:
- Strategic uncertainty following the February 2026 announcement of exploring a sale
- Custom pricing at the enterprise level
- ETL processing can be slower than dedicated data pipeline tools for large volumes
Pricing: Custom enterprise pricing.
Best for: Organizations with highly diverse data sources that need 1,000+ native connectors and no-code data transformation alongside analytics — if the strategic situation stabilizes.
11. Klipfolio
The best BI tool for SMBs that need KPI dashboards fast without data engineering
Klipfolio is a cloud-based KPI dashboard platform designed specifically for small and mid-sized businesses that need to track marketing, sales, and operational metrics without building a data warehouse or hiring a BI specialist. It connects to over 130 data sources, including HubSpot, Google Analytics, Salesforce, Xero, and Shopify, through pre-built connectors, and its library of pre-built KPI templates covers the most common SMB reporting use cases.
Setup for a standard marketing or sales dashboard typically takes less than a day, which makes Klipfolio one of the fastest paths to a functional KPI dashboard in the market. The interface is clean, and the resulting dashboards display well on TV monitors in office environments, which is a genuine use case for many growing businesses.
What it does well:
- 130+ pre-built connectors covering the most common SMB data sources
- KPI template library covers marketing, sales, and operations use cases out of the box
- Fast setup — standard dashboards live within hours, not weeks
- Clean TV dashboard display mode for office monitoring
- Transparent pricing starting from $90/month
Where it falls short:
- Not suitable for complex data modeling or enterprise-scale analytics requirements
- Less analytical depth than Power BI or Tableau for advanced use cases
- Customization of pre-built templates requires more effort than building from scratch in some cases
Pricing: From $90/month. Business and custom enterprise plans available.
Best for: SMBs with 10 to 200 employees that need fast, clean KPI dashboards tracking marketing, sales, and operational metrics from common SaaS tools without data engineering resources.
12. Zoho Analytics
The best budget BI platform for teams in the Zoho ecosystem
Zoho Analytics provides a solid self-service BI feature set including drag-and-drop report building, AI-powered Ask Zia natural language querying, automated report generation, and collaboration tools at a price point that significantly undercuts Power BI and Tableau. The free plan covers two users, and the paid Standard plan starts at $24 per month for two users.
For organizations already using Zoho CRM, Zoho Books, or Zoho Projects, the native integration means business data flows into analytics dashboards without additional connectors. Zia AI lets non-technical users ask questions about their data in natural language and receive chart suggestions and anomaly alerts.
What it does well:
- Most affordable BI platform on this list with genuine analytical depth
- Free plan for two users and paid plans from $24/month
- Native integration with the full Zoho suite — CRM, Books, Projects, and more
- Zia AI for natural language queries and automated insight generation
- Good data blending across multiple sources without SQL
Where it falls short:
- Best value for organizations already in the Zoho ecosystem
- Less visualization sophistication than Tableau or Power BI for complex analytical outputs
- Connector availability for non-Zoho data sources is narrower than that of Power BI
Pricing: Free for 2 users. Standard from $24/month (2 users). Premium and Enterprise plans scale with users.
Best for: SMBs already using Zoho CRM or other Zoho products that want affordable self-service BI without adding a separate vendor to their stack.
13. Databox
The best KPI tracking tool for marketing and sales teams at SMB scale
Databox is a performance management and BI platform focused specifically on helping marketing, sales, and executive teams track KPIs and OKRs without data engineering involvement. It connects to over 100 data sources, including HubSpot, Salesforce, Google Analytics, Facebook Ads, and Shopify, and its pre-built Databoard templates get marketing and sales dashboards live in minutes.
The free plan covers three data source connections and three users, which is genuinely useful for early-stage companies tracking their core growth metrics without a paid subscription. The Starter plan at $47/month adds more connections and historical data access.
What it does well:
- 100+ pre-built connections to marketing and sales data sources
- Pre-built Databoard templates for common marketing, sales, and executive reporting
- Free plan genuinely usable for very small teams
- Scorecard feature for tracking OKRs and KPI performance against targets
- Alert system notifies teams when metrics move above or below thresholds
Where it falls short:
- Not designed for complex operational or financial analytics beyond KPI tracking
- Less customization depth than Power BI or Tableau for advanced requirements
- Historical data access limited on lower-tier plans
Pricing: Free (3 connections, 3 users). Starter from $47/month. Professional and custom plans available.
Best for: Early-stage companies and SMB marketing and sales teams that need fast, clean KPI dashboards from common SaaS tools with a free starting tier.
14. Holistics
The best SQL-first BI platform for modern data teams that want governed self-service reporting
Holistics is an SQL-first BI platform built around semantic modeling, governed reporting, and self-service analytics. It lets data teams define metrics and business logic centrally in a semantic layer, then surface governed dashboards to business users who can explore and filter without writing SQL themselves. For data teams frustrated by the “multiple versions of the truth” problem where different departments calculate the same metric differently, Holistics solves this at the data modeling layer.
The platform is particularly strong for companies that want a reliable, low-cost alternative to Looker’s semantic layer approach without Google Cloud pricing.
What it does well:
- The centralized semantic layer ensures consistent metric definitions across all teams
- Data teams write the logic once, and business users explore without writing SQL
- Strong version control and collaborative modeling workflow for data teams
- More affordable than Looker for companies not on Google Cloud
- Good documentation and active developer community
Where it falls short:
- Initial setup requires SQL expertise and data modeling investment
- Not designed for true non-technical self-service dashboard building
- Less brand recognition than Power BI, Tableau, or Looker
Pricing: From $200/month for small teams. Scales with users and features.
Best for: Data teams at mid-market companies that want governed semantic layer analytics at a more accessible price point than enterprise BI platforms, without committing to Google Cloud for Looker.
15. GoodData
The best enterprise BI platform for multi-tenant and embedded analytics at scale
GoodData is a cloud analytics platform built for organizations that need to deliver governed analytics to multiple tenants — either internal business units or external customers. Its multi-tenant architecture allows a single GoodData deployment to serve hundreds of organizations with isolated data and customized dashboards, which makes it the strongest choice for SaaS companies delivering analytics as a product feature or enterprises with complex internal governance requirements.
What it does well:
- Multi-tenant architecture for delivering analytics to multiple isolated customer or business unit instances
- Strong governance controls with granular permission management
- Headless BI capabilities for embedding analytics into any application via API
- AI-powered automated insight generation across connected datasets
- Proven at enterprise scale for companies delivering analytics as a product
Where it falls short:
- Not designed for simple internal business reporting by non-technical teams
- Custom enterprise pricing requires a sales conversation
- Implementation complexity is high for simple use cases
Pricing: Custom enterprise pricing.
Best for: Enterprise companies and SaaS vendors that need to deliver governed, multi-tenant analytics at scale, either as an embedded product feature or across large, complex internal organizations.
16. Luzmo
The best embedded BI platform for SaaS companies building analytics into their product
Luzmo (formerly Cumul.io) is an embedded analytics platform designed for SaaS product teams that want to add white-label dashboards and data visualization to their product without building an analytics engine from scratch. It provides a drag-and-drop dashboard editor that customers can use to build their own reports within the SaaS product, plus a developer API for embedding dashboards programmatically.
At $149/month to start, Luzmo is more accessible than Sisense or GoodData for early-stage SaaS companies that want to add analytics capabilities to their product without enterprise pricing.
What it does well:
- Accessible entry pricing at $149/month — significantly lower than Sisense or GoodData
- Customer-facing drag-and-drop dashboard editor for in-product self-service analytics
- Flexible embedding via JavaScript SDK or iframe
- Multi-tenant data isolation ensures customers only see their own data
- Fast time to first embedded dashboard — typically days rather than months
Where it falls short:
- Less feature depth than Sisense or GoodData for very large enterprise embedded use cases
- Requires developer resources for initial integration
- Less visualization sophistication than Tableau for complex analytical outputs
Pricing: From $149/month. Growth and custom enterprise plans available.
Best for: Early-stage and mid-market SaaS companies that want to embed customer-facing analytics dashboards into their product at an accessible price point without enterprise BI infrastructure investment.
17. Yellowfin BI
The best enterprise BI platform for organizations that prioritize data storytelling alongside reporting
Yellowfin BI is a full-stack enterprise BI platform covering dashboards, reports, data discovery, and collaborative analytics alongside its distinctive data storytelling module. Yellowfin Stories lets analysts build narrative reports that combine visualizations, written analysis, and dynamic data in a format that non-technical executives can read and act on without logging into a separate dashboard tool.
For organizations where the challenge is not just producing data but communicating it effectively to decision-makers who do not engage with traditional dashboards, Yellowfin’s storytelling approach addresses a genuine gap.
What it does well:
- The data storytelling module combines narrative writing with live data visualizations
- Signals feature monitors KPIs and automatically narrates what changed and why
- Strong self-service dashboard building alongside traditional governed reporting
- Good fit for organizations that want both BI and automated data narratives in one platform
- Embedded analytics capability for product teams
Where it falls short:
- Less brand recognition than Power BI, Tableau, or Qlik in North America
- Custom pricing requires a sales conversation
- Less suitable as a standalone tool for very small teams without dedicated BI resources
Pricing: Custom enterprise pricing.
Best for: Enterprise organizations that need to communicate data insights to non-technical executives through narrative reports alongside traditional dashboards, and companies that want automated data storytelling alongside standard BI reporting.
How to Choose the Right BI Tool for Your Non-Technical Team
The most common BI mistake is choosing a tool based on its feature list rather than based on who will actually use it day-to-day. A platform that is powerful but requires SQL expertise to get value from will not get used by business teams, regardless of how impressive the demo looked. Four questions narrow the field quickly.
Who will build the dashboards?
If a dedicated data analyst or BI professional builds dashboards that business users then consume, Tableau, Looker, or Qlik Sense deliver the best analytical outputs.
If business users themselves need to build and maintain their own dashboards without data team involvement, Power BI, Klipfolio, Databox, or Metabase produce the fastest and most reliable adoption. Matching the tool to the actual builder, not the eventual viewer, is the most important decision.
Where does your data actually live?
Organizations with data primarily in Google’s ecosystem (Google Analytics, Ads, Sheets, BigQuery) get the most value from Looker Studio or Looker. Organizations in the Microsoft ecosystem get the most from Power BI. Teams with data spread across a modern cloud data warehouse like Snowflake or Databricks should evaluate Sigma or ThoughtSpot.
Teams using Zoho products should consider Zoho Analytics. Buy the tool that connects to your actual data sources without a data engineering project, not the one with the best-looking demo on sample data.
What is your realistic data maturity?
Organizations at an early data maturity stage, with data in spreadsheets and SaaS tools, should start with Looker Studio, Klipfolio, Databox, or Metabase.
Organizations with structured databases and some SQL capability should evaluate Power BI, Zoho Analytics, or Holistics. Organizations with a modern cloud data warehouse and a dedicated data team should evaluate Tableau, Looker, Sigma, or ThoughtSpot.
What is the total cost of getting useful dashboards live?
Headline pricing understates real cost. Power BI Pro at $10/user/month sounds affordable, but connecting non-Microsoft data sources often requires a data engineer. Tableau Creator at $75/user/month sounds expensive, but a skilled Tableau developer can build dashboards that serve the entire organization from one license.
Free tools like Looker Studio and Metabase Community have zero licensing cost but require technical setup time. Model the fully-loaded cost of getting to a useful first dashboard, not just the per-seat price.
Frequently Asked Questions
What is the best business intelligence tool for non-technical teams?
Microsoft Power BI is the strongest overall choice for most non-technical business teams, combining accessibility, Microsoft 365 integration, Copilot AI, and competitive pricing. For teams that primarily use Google products, Looker Studio is the best free option.
For SMBs wanting KPI dashboards from marketing and sales tools without data engineering, Klipfolio or Databox are faster to set up. For the most intuitive natural language querying for non-technical users, ThoughtSpot is the category leader.
What is the difference between Power BI and Tableau?
Power BI is stronger for Microsoft-ecosystem teams, offers better value at lower price points, and has a gentler learning curve for business analysts building their own reports. Tableau produces higher-quality visualizations, has deeper analytical capability for complex calculations, and is preferred by dedicated data visualization professionals.
For most mid-market business teams, Power BI delivers better value. For data-forward teams where visualization quality is a competitive differentiator, Tableau’s outputs justify the higher cost.
Is there a free business intelligence tool worth using?
Yes. Looker Studio is completely free and covers the core BI needs of any team with data in Google’s ecosystem. Metabase’s Community edition is free when self-hosted and covers non-technical querying and dashboard building.
Databox and Zoho Analytics both have functional free tiers. Power BI Desktop is free for individual use but requires a paid license for organizational sharing.
How long does it take to implement a BI tool?
Implementation time varies widely by tool and use case. Looker Studio and Databox get to a first useful dashboard in under an hour. Klipfolio and Metabase cloud typically deploy in one to three days.
Power BI and Zoho Analytics take one to four weeks for a properly structured implementation. Tableau, Looker, and Sigma take two to eight weeks. Enterprise platforms like Qlik, ThoughtSpot, and GoodData typically require one to three months for full deployment.
What is self-service BI?
Self-service BI refers to tools that allow business users to create their own reports, dashboards, and data queries without requiring assistance from a data analyst or IT team. The goal is to give non-technical users direct access to data exploration and visualization capabilities through intuitive drag-and-drop interfaces, natural language querying, and pre-built connectors.
According to Forrester Research, organizations with high self-service BI adoption report significantly faster response times to business questions and lower dependence on centralized data teams.
Do I need a data warehouse to use BI software?
Not for most SMB and mid-market use cases. Tools like Power BI, Klipfolio, Databox, and Looker Studio connect directly to SaaS tools and databases without a separate data warehouse.
A dedicated data warehouse becomes valuable when you need to combine data from many sources, run complex historical analyses, or serve large numbers of concurrent dashboard users. For teams just starting their BI journey, connecting directly to existing data sources is the right place to begin.
Final Verdict
For most non-technical business teams, Microsoft Power BI is the strongest starting point. It covers the widest range of use cases, benefits from Copilot AI for natural language querying, integrates natively with the tools most organizations already use, and costs $10 per user per month for organizational sharing.
For teams whose data lives primarily in Google’s ecosystem, Looker Studio is the best free first step. For SMBs that want KPI dashboards from marketing and sales tools up and running within a day, Klipfolio or Databox are faster to productive use than Power BI for that specific use case.
For organizations with a modern cloud data warehouse and non-technical users who need to query data themselves, ThoughtSpot’s natural language approach removes more friction than any other platform. For the most accessible open-source option, Metabase delivers genuine analytical value at the lowest total cost.
For enterprises where visualization quality is the priority and training investment is available, Tableau remains the gold standard. And for SaaS companies building analytics into their products, Sisense, GoodData, or Luzmo each offer a compelling embedded analytics path at different price points.
The most common mistake is choosing a tool that is too powerful for your current data maturity. Start with what your team will actually use, get dashboards live quickly, and upgrade when you have genuinely outgrown it.
For more B2B software reviews and comparisons, browse the AllTopBusiness blog. Have a specific BI tool question for your team? Contact us directly.

I’m Adeyemi Adetilewa, a Content Marketing and SEO Specialist, Digital Strategist, Entrepreneur, and the Editor of AllTopBusiness.com. With over 13 years of experience helping businesses scale through content-driven growth, I’m happy to share all the top business tools I have discovered with you here.