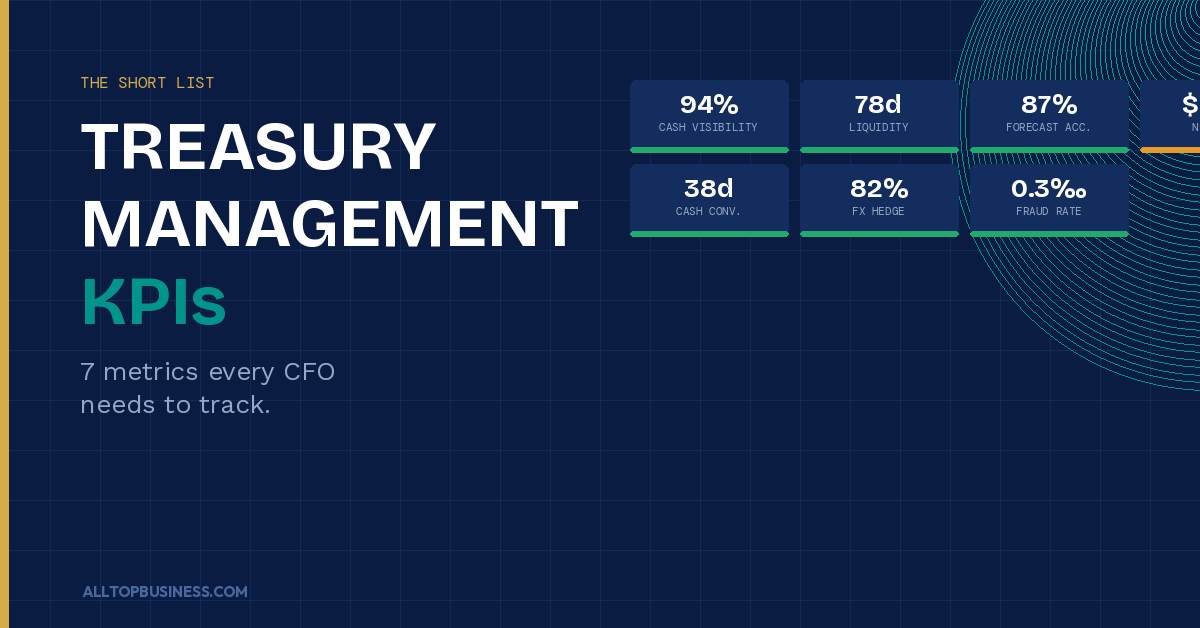
The core treasury management KPIs every CFO should track are cash visibility percentage, daily liquidity coverage, cash flow forecast accuracy, net debt and cost of funds, cash conversion cycle, FX hedge coverage ratio, and payment fraud rate. This guide explains each one, gives you benchmark targets, and shows you how to wire them into a dashboard your leadership team will actually use.
Most finance teams do not have a data problem. They have a signal-to-noise problem.
Between the ERP, the TMS, the bank portals, and the weekly FP&A pack, a CFO can easily be looking at 40 or 50 metrics on any given Monday morning. When everything looks important, nothing stands out. And the one metric that actually matters, the one flashing yellow before a cash shortfall or a surprise FX loss, gets buried.
That is the problem a focused set of treasury management KPIs solves.
This guide covers the KPIs that give you a genuine early warning system for your cash, risk, and funding position. Each one comes with a plain-English explanation of what it measures, why it matters, what a healthy target looks like, and how modern treasury software can automate the tracking. No 40-item dashboards. No vanity metrics.
If you want to understand the broader treasury function before diving into the metrics, our guide on what treasury management is and why it matters is a good starting point.
Why Treasury KPIs Matter More Than Ever in 2026
Treasury has moved from a transaction-processing function to a strategic one. CFOs are now expected to manage not just cash, but geopolitical risk, real-time payment exposure, multi-entity liquidity structures, and increasingly volatile FX markets.
That expanded scope makes the right KPIs more critical than ever. A few specific data points from 2026 illustrate how much is at stake:
A 60% accurate cash forecast at the 13-week horizon forces CFOs to maintain larger liquidity buffers, limits the precision of revolving credit facility drawdowns, and reduces the confidence of working capital optimization decisions. Every working capital action taken against a forecast that is wrong 40% of the time carries compounding risk.
Teams using AI-powered collection prediction agents are reporting average DSO improvements of 2 to 4 days within 90 days of deployment, translating directly into millions of dollars in released working capital for mid-market and enterprise companies.
And according to PwC’s Global Treasury Survey, 74% of treasurers rank real-time cash visibility as their top priority, yet most still struggle with fragmented data across multiple banking relationships and systems.
The right KPIs make all of this visible. Here is the short list.
The 7 Core Treasury Management KPIs
1. Cash Visibility Percentage
What it measures: The share of your organization’s total cash that is accessible and reportable in real time across all accounts, currencies, and platforms.
Formula: (Cash visible in real time / Total cash held across all accounts) x 100
Why it matters: In 2026, treasury teams manage liquidity across global banking partners, fintech platforms, virtual accounts, multi-entity structures, and sometimes digital asset platforms. Cash is more distributed than ever. If a significant portion of your cash is invisible, sitting in subsidiary accounts, delayed bank feeds, or unconnected systems, you cannot manage it effectively.
A cash visibility percentage below 80% is a red flag. It means decisions about investments, drawdowns, and intercompany funding are being made with incomplete information.
Healthy benchmark: 90% or above for mid-market companies, 95% or above for enterprises with a deployed TMS.
How to improve it: Direct API connectivity to banks through a TMS like Trovata or GTreasury pulls real-time bank data without the overnight lag of traditional file-based feeds. Our guide to the best treasury software solutions covers which platforms handle bank connectivity best.
2. Daily Liquidity Coverage
What it measures: How many days the business can continue operating using its current unrestricted cash plus committed credit facilities, at the current rate of cash burn.
Formula: (Unrestricted cash + Available revolver capacity) / Average daily operating cash outflows
Why it matters: This is the most immediate stress test for your treasury position. It answers the question that matters most in any cash crunch: how much runway do we have?
A well-run business typically targets 60 to 90 days of liquidity coverage under normal conditions, with a minimum floor of 30 days even in tight periods. High-growth companies burning cash aggressively may operate with less, but they should do so deliberately and with active monitoring.
This KPI also tells you how much capacity you have for offensive moves: acquisitions, share buybacks, or accelerated investment spending. A strong liquidity coverage position gives you optionality. A weak one forces reactive decisions.
Healthy benchmark: 60 to 90 days for most B2B companies. Less than 30 days warrants immediate action.
Useful slice: Break this down by region or entity if you operate a multi-country structure. Trapped cash in jurisdictions with capital controls does not contribute to your real liquidity position.
3. Cash Flow Forecast Accuracy
What it measures: How closely your 13-week rolling cash forecast tracks actual cash outcomes, expressed as the percentage variance between forecasted and actual cash positions.
Formula: 1 – (|Forecasted cash – Actual cash| / Actual cash) x 100, measured weekly or monthly
Why it matters: The 13-week cash forecast is the heartbeat of treasury operations. Its accuracy determines how much buffer cash you need to hold, how confidently you can manage your credit facility, and how much trust your board and lenders place in your financial management.
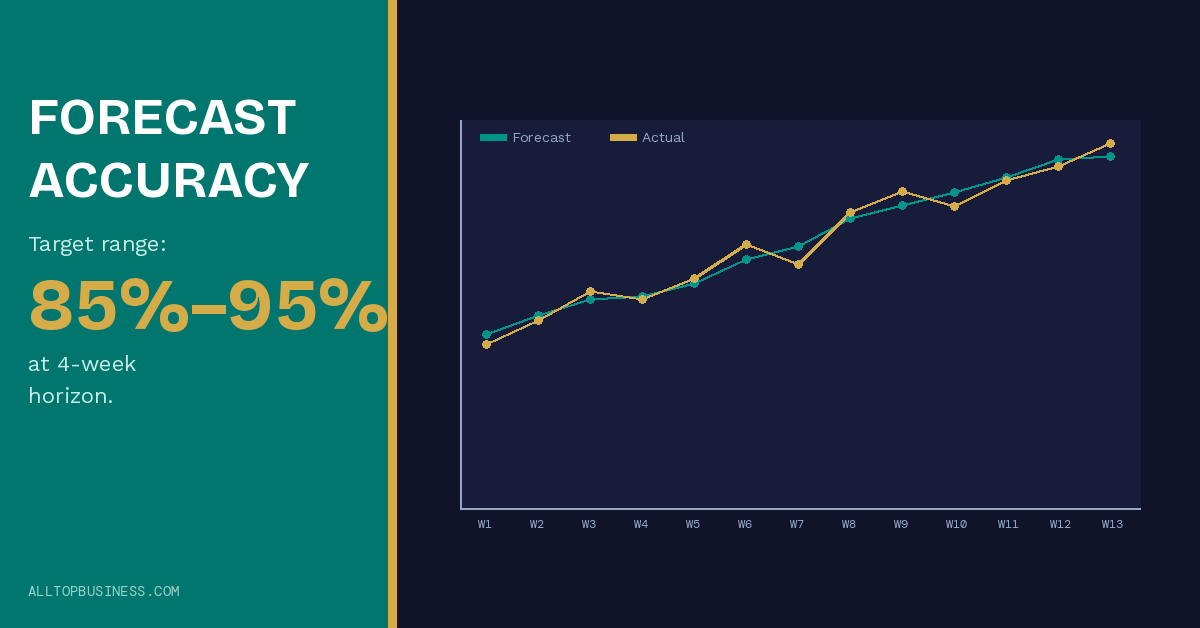
A forecast accuracy below 70% at the 4-week horizon is a serious operational problem. It signals that input data from sales, procurement, or FP&A is unreliable, or that your forecasting process is too manual to keep up with business reality.
Top-performing treasury teams target 85% to 95% accuracy at the 4-week horizon and 75% to 85% at the 13-week horizon. AI-powered forecasting tools are now pushing these numbers significantly higher for teams that have deployed them.
Healthy benchmark:
- 4-week horizon: 85% to 95% accuracy
- 13-week horizon: 75% to 85% accuracy
- Below 70% at any horizon: indicates a process or data quality problem that needs addressing
How to improve it: The most common causes of poor forecast accuracy are late or unreliable AR data, manual data collection from business units, and failure to incorporate committed but not yet invoiced revenue. Our detailed guide on cash forecasting for treasury teams walks through how to build a more reliable process.
4. Net Debt and Average Cost of Funds
What it measures: Two connected metrics that together show the size of your debt position and what it actually costs the business to carry that debt.
Formulas:
- Net debt: Total interest-bearing debt minus unrestricted cash
- Average cost of debt: Annual interest expense / Average debt balance outstanding
Why it matters: Net debt alone tells you the size of your leverage. But it does not tell you whether that leverage is sustainable, how exposed you are to rate movements, or when the refinancing clock starts ticking.
The average cost of funds adds the dimension of efficiency. A company with $50M in net debt at 4.5% average cost is in a very different position from one with $50M at 8.2%, especially in an environment where base rates have been volatile.
Together, these two metrics give you the starting point for every refinancing discussion, every capital allocation decision, and every conversation with your banking partners about facility terms.
Healthy benchmark: Industry and growth-stage dependent, but an average cost of debt above 200 basis points over your benchmark rate warrants a review of refinancing options.
What to watch: Track the average cost of debt quarterly and model sensitivity to rate moves of 50 and 100 basis points. Any significant maturity wall in the next 18 months should trigger proactive refinancing planning, not reactive scrambling.
5. Cash Conversion Cycle (CCC)
What it measures: The number of days cash is tied up in operations from the moment you pay a supplier to the moment you collect from a customer.
Formula: Days Sales Outstanding (DSO) + Days Inventory Outstanding (DIO) – Days Payable Outstanding (DPO)
Why it matters: The CCC is the most powerful working capital metric in your arsenal because it captures three different levers in a single number. A shorter CCC means cash cycles through the business faster, reducing the need for external financing and improving returns on capital.
Each component tells a different operational story:
- DSO reflects how quickly your customers pay. A rising DSO could mean collections are slipping, customer financial health is deteriorating, or invoicing processes are creating unnecessary delays.
- DIO reflects inventory efficiency. Too much stock ties up cash; too little risks stockouts. For service businesses, this component is often zero or near-zero.
- DPO reflects how effectively you use supplier credit. Extending payment terms within agreed limits is a legitimate working capital tool, but pushing DPO beyond what suppliers will accept damages relationships and supply chain reliability.
Healthy benchmark: Highly industry-dependent. Retail typically targets CCC below 30 days. Manufacturing ranges from 45 to 90 days. Professional services firms with no inventory often focus purely on DSO, targeting below 45 days.
The practical approach: If you are early in your working capital measurement journey, start with DSO and DPO first. Add DIO when your inventory data is clean and consistent enough to trust.
6. FX Hedge Coverage Ratio
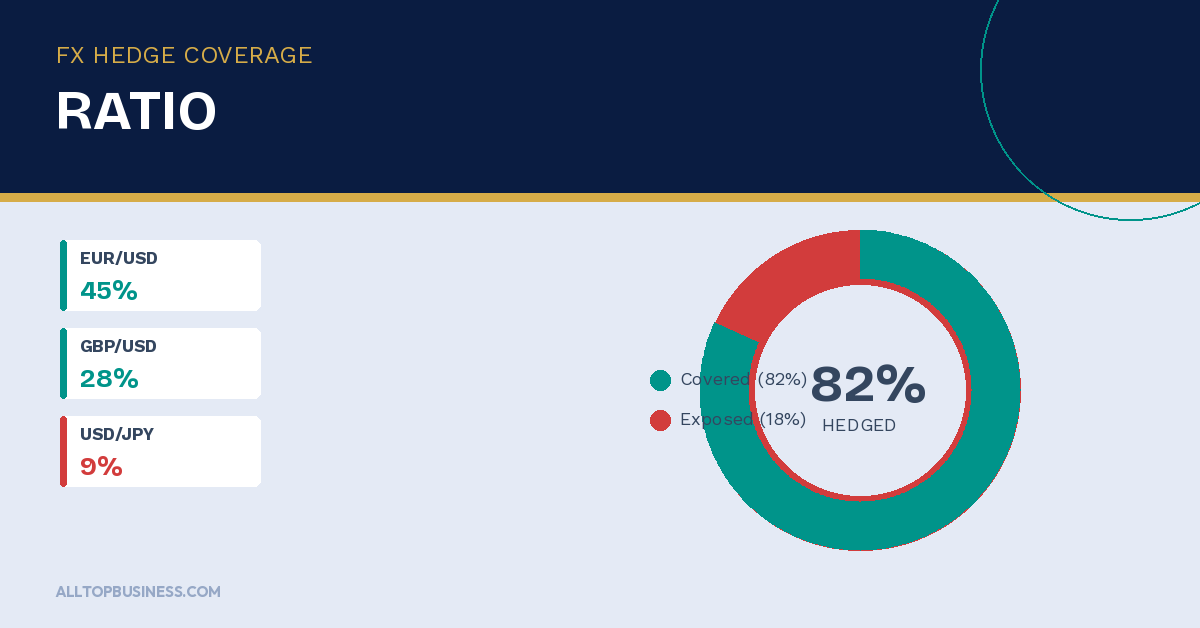
What it measures: The percentage of your identified foreign currency exposure that is currently covered by hedges in line with your treasury policy.
Formula: (Value of FX exposures hedged / Total identified FX exposure) x 100
Why it matters: For any company that pays suppliers in foreign currencies, invoices customers in non-functional currencies, or holds significant assets or liabilities in other currencies, unhedged FX exposure is a direct profit and loss risk.
The FX hedge coverage ratio tells you two things at once: how much of your exposure is protected, and whether your hedging activity is staying within the parameters your board has approved. Falling below your policy minimum is both a risk management failure and a governance issue.
In volatile FX environments, this metric deserves more frequent attention. Currency moves of 5% to 10% against an unhedged position can wipe out the profit margin on an entire quarter of overseas sales or purchases.
Healthy benchmark: Policy-dependent, but most corporate treasury policies target 60% to 90% coverage of forecasted exposures at the 3 to 6-month horizon. Anything below policy minimums requires explanation to the CFO and board.
Further reading: Our guide on FX risk management for businesses that pay overseas suppliers covers how to identify your exposure and build a practical hedging approach.
7. Payment Fraud Rate and Policy Compliance
What it measures: The percentage of payment transactions that triggered a fraud flag, were stopped by controls, or violated payment policy expressed as a rate per thousand transactions.
Formula: (Number of flagged or stopped payment transactions / Total payment transactions) x 1,000
Why it matters: Payment fraud targeting businesses has grown significantly in sophistication. Business email compromise, invoice fraud, and internal payment manipulation are among the fastest-growing categories of financial crime. Treasury is the last line of defense.
Tracking your fraud detection and policy compliance rate does two things. First, it tells you whether your payment controls are catching what they should catch. Second, it gives you documented evidence for auditors and insurers that your controls are operating as designed.
A zero-incident rate is not always reassuring. It may mean your controls are not sensitive enough to detect attempts, not that none are happening. The best treasury teams review fraud metrics alongside their control configurations to ensure the detection layer is genuinely active.
Healthy benchmark: Payment fraud losses for businesses vary by industry and size. The more useful benchmark is internal trend analysis: is your detection rate improving or deteriorating quarter over quarter?
How to improve it: Modern TMS platforms and payment hubs include built-in fraud detection that screens outgoing payments against rules, whitelists, and behavioral baselines before funds leave the account. This is one of the strongest arguments for implementing a dedicated treasury platform rather than processing payments directly through banking portals.
How to Build a Treasury KPI Dashboard Leaders Actually Use
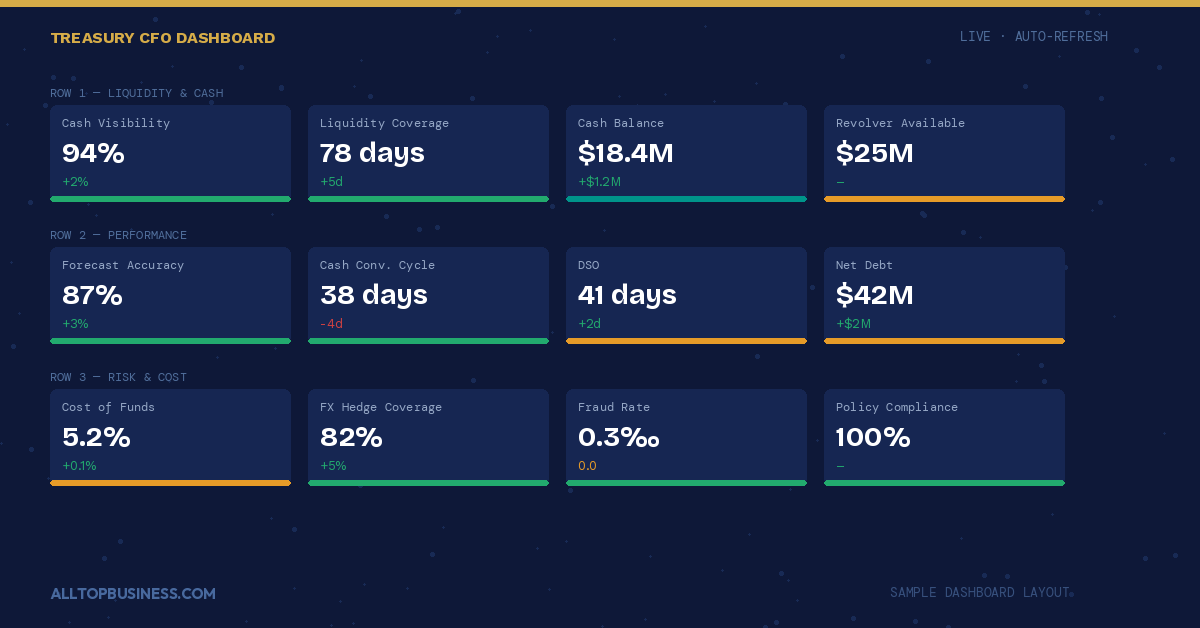
A good treasury dashboard gives leadership a complete picture of cash, risk, and funding health in under two minutes. No scrolling, no exports, no digging through drill-downs to find the number they asked for last week.
Here is a simple three-row layout that works for most mid-market and enterprise companies:
Top row — Liquidity and cash position: Cash visibility percentage | Daily liquidity coverage (days) | Cash balance vs. prior week
Middle row — Performance and efficiency: 13-week forecast accuracy | Cash conversion cycle | Net debt
Bottom row — Risk and cost: Average cost of funds | FX hedge coverage ratio | Payment fraud rate
Each metric should show the current value, the prior period comparison, and a simple red/amber/green status against your defined range. No charts necessary at the summary level. Charts belong in the drill-down views that your treasury team owns.
The best modern treasury platforms pull all of this data automatically from bank feeds, ERP integrations, and internal forecasting models. If you are still building this manually in Excel, that is the first problem to solve. Explore the best treasury software solutions to find a platform that matches your team size and complexity.
Best Practices to Keep Treasury KPIs Actionable
Tracking KPIs is easy. Making them drive decisions is harder. Here is what separates treasury teams whose dashboards change behavior from those whose dashboards get looked at once a week and then ignored.
1. Limit the core set.
Seven KPIs at the CFO level are already near the maximum. Five or six is better. Extra granularity belongs in drill-down views owned by the treasury team, not in the executive summary.
2. Assign owners, not just watchers.
Every KPI should have a single business owner accountable for moving the number. DSO sits with collections. DPO sits with procurement. Forecast accuracy sits with whoever owns the forecasting process. Without ownership, metrics become information rather than accountability tools.
3. Set ranges, not single point targets.
A liquidity coverage range of 60 to 90 days is more useful than a single target of 75 days. Ranges keep conversations focused on whether you are in bounds or out of bounds, rather than endless debates about whether 74 days is acceptable.
4. Align review cadence to risk level.
Cash visibility and liquidity coverage should be reviewed daily or weekly during tight cash periods. Net debt and cost of funds can be monthly or quarterly. FX hedge coverage should track the pace of your hedging program. Not everything needs a weekly meeting.
5. Use actuals to improve forecasts.
Every time your 13-week forecast misses by more than 5%, that variance is a learning opportunity. Root-causing the miss. Was it a late customer payment, an unplanned vendor invoice, or a payroll timing issue? It makes your next forecast more accurate. Forecasts that never get examined never get better.
Frequently Asked Questions
How many KPIs should a treasury dashboard have?
Five to seven at the CFO level is the practical maximum. More than that, and the dashboard stops being a decision tool and starts being a reporting exercise. Extra detail belongs in drill-down views that the treasury team reviews, not in the executive summary.
What is a good cash forecast accuracy target?
For the 4-week horizon, top-performing treasury teams target 85% to 95% accuracy. At the 13-week horizon, 75% to 85% is considered strong. Below 70% at any horizon signals a data quality or process problem that needs to be addressed before the forecast can be trusted for decision-making.
What is the cash conversion cycle, and why does it matter?
The cash conversion cycle (CCC) measures how many days it takes for cash to cycle through your operations from paying suppliers to collecting from customers. A shorter CCC means your business generates cash faster and needs less working capital financing. It is calculated as DSO + DIO – DPO.
How often should treasury KPIs be reviewed?
It depends on the metric. Cash visibility and liquidity coverage should be reviewed daily or weekly. Cash conversion cycle and net debt work well as monthly reviews. FX hedge coverage should be reviewed whenever new hedges are placed or exposures change materially.
What tools are best for tracking treasury KPIs?
Modern treasury management systems like GTreasury, Kyriba, Trovata, and HighRadius automate KPI tracking by pulling data directly from bank feeds and ERP systems. The right platform depends on your company size, ERP environment, and complexity. See our full breakdown in the best treasury software guide.
What is the difference between DSO and cash conversion cycle?
DSO measures only the receivables side, how quickly customers pay after invoicing. The cash conversion cycle is a broader metric that combines DSO with inventory days and payables days to give a complete picture of working capital efficiency across the entire operating cycle.
Final Thoughts
Treasury will always generate more data than any leadership team can absorb. The job of a good CFO is not to track everything; it is to track the right things with enough precision to act before problems become crises.
The seven KPIs in this guide give you clear sight lines into every dimension of treasury performance: cash visibility, liquidity runway, forecast reliability, debt cost, working capital efficiency, FX risk coverage, and payment security. Together, they form a complete early warning system for your balance sheet.
Start with three or four. Assign owners. Put them in front of your leadership team monthly. Add more only when a specific decision depends on a metric you are not currently tracking.
For more guides on treasury management and B2B finance tools, browse the AllTopBusiness blog. Have a specific question about your treasury metrics or tool selection? Reach out to our team directly.
External Sources:
- Association for Financial Professionals — Treasury KPI Resources
- Ramp — Top Treasury KPIs to Track in 2026

I’m Adeyemi Adetilewa, a Content Marketing and SEO Specialist, Digital Strategist, Entrepreneur, and the Editor of AllTopBusiness.com. With over 13 years of experience helping businesses scale through content-driven growth, I’m happy to share all the top business tools I have discovered with you here.